How do you healthcheck your containers?
from Sunny@slrpnk.net to selfhosted@lemmy.world on 15 Dec 2025 22:34
https://slrpnk.net/post/31530248
from Sunny@slrpnk.net to selfhosted@lemmy.world on 15 Dec 2025 22:34
https://slrpnk.net/post/31530248
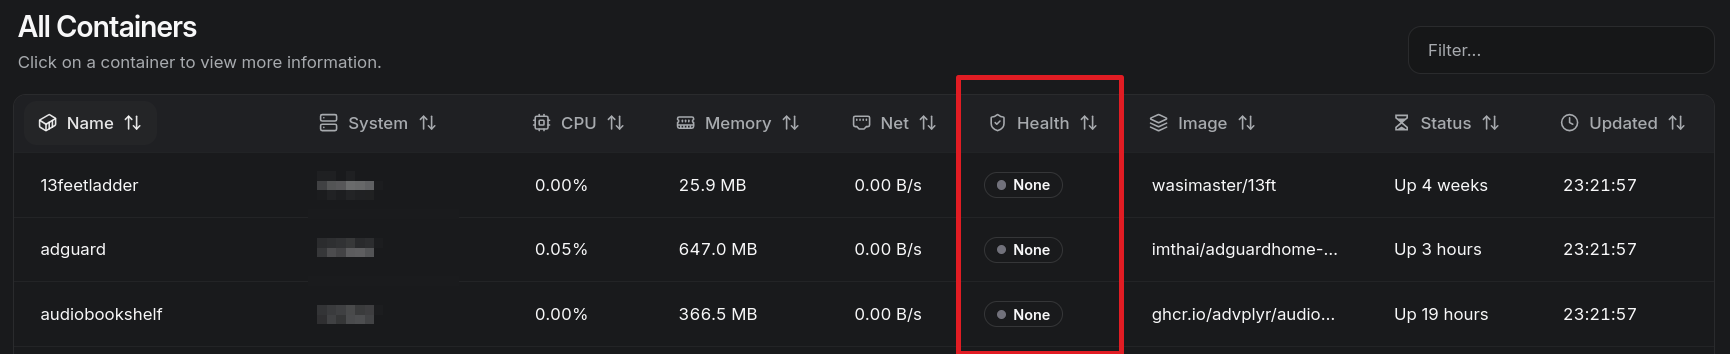
So recently been spending time configuring my selfhosted services with notifications usint ntfy. I’ve added ntfy to report status on containers and my system using Beszel. However, only 12 out of my 44 containers seem to have healthcheck “enabled” or built in as a feature. So im now wondering what is considered best practice for monitoring the uptime/health of my containers. I am already using uptimekuma, with the “docker container” option for each of my containers i deem necessary to monitor, i do not monitor all 44 of them 😅
So I’m left with these questions;
- How do you notify yourself about the status of a container?
- Is there a “quick” way to know if a container has healthcheck as a feature.
- Does healthcheck feature simply depend on the developer of each app, or the person building the container?
- Is it better to simply monitor the http(s) request to each service? (I believe this in my case would make Caddy a single point of failure for this kind of monitor).
Thanks for any input!
threaded - newest
I use Gatus in conjunction with http APIs for health checking. For services that don’t support that, you can always pattern match the HTML code.
So many upvotes without a comment :/ Sadly I don’t have much useful info to add either, I’m looking forward to how others do it as well, since I recently noticed this panel in Beszel too.
Honestly, I use the status icons in Homepage dashboard as a health check, since I always use my dashboard to navigate to apps. Red status indicator -> I have to go fix it. Nothing more severe.
But for point 3 I do have a strong hunch that it depends on the container image creator - a health check is usually just a command that either succeeds or not (or a http response that gets a 200 or not), so it can be as simple as pointing a request to the root url of the app.
Of course, this is not the most performant way to check this, which is why app makers may also put in explicit liveness/readiness or similar endpoints that return a really short json to indicate their status. But for the containers that have a healthcheck, they must be implemented in the image (too) I think
I usually notice if a container or application is down because that usually results in something in my house not working. Sounds stupid, but I’m not hosting a hyper available cluster at home.
Check the documentation
If the developer adds a healthcheck feature, you should use that. If there is none, you can always build one yourself. If it’s a web app, a simple HTTP request does the trick, just validate the returned HTML - if the status code is 200 and the output contains a certain string, it seems to be up. If it’s not a web app, like a database, a simple
SELECT 1on the database could tell you if it’s reachable or not.If you only run a bunch of web services that you use on demand, monitoring the HTTP requests to each service is more than enough. Caddy being a single point of failure is not a problem because your caddy being dead still results in the service being unusable. And you will immediately know if caddy died or the service behind it because the error message looks different. If the upstream is dead, caddy returns a 502, if caddy is dead, you’ll get a “Connection timed out”
For databases, many like postgres have a ping / ready command you can use to ensure it’s up and not have the overhead of an actual query! Redis is the same way (I feel like pg and redis health checks covers a lot of the common stack patterns)
Yeah fair enough this, personally want to monitor backend services too just for good measure. Also to prove to my friends and family that i can maintain a higher uptime % than cloudflare 🤣
If you’re looking for this you can use something like uptime kuma, which pings each service and looks for a specific response or it will ping you
I doubled down recently and now have Grafana dashboards + alerts for all of my proxmox hosts, their containers etc.
Alerts are mainly mean CPU, memory or disk utilization > 80% over 5 minutes
I also get all of my notifications via a self hosted ntfy instance :~)
As i wrote in my post, im already using uptimekuma to monitor my services. However if i choose the “docker container” mode foe uptimekuma to monitor it cant actually so that, as there is no health feature in most containers, so this results in 100% downtime 🙃 Other way would to do it would to just check the url of the service whoch ofc works too, but its not a “true” health check.
When something doesn’t work, I do
sudo docker pslol.This isnt really the same as a health check. PS just checks that the process is up and running, but it could be lagging or deadlocked, or the socket closed.
A proper healthcheck checks if the application is actually healthy and behaving correctly.
<img alt="" src="https://lemmy.ca/pictrs/image/7d24ae69-5ae1-47ca-946f-1b7b807891a4.jpeg">
I decided that at my scale, NixOS is easier to maintain. So for me its just a `systemctl status <thing I host>ˋ
Fascinating. How does this help op?
With Podman and Quadlets you can use the same command to check on containers as well. The Systemd integration of Podman is pretty neat.
Yeah eventually i will transition to this but not until after i migrate away from Unraid for more granular control. Looking forward to it though!
If I go to its web interface (because everything is a web interface) and it’s down, then I know it has a problem.
I could set up monitoring, but I wouldn’t care enough to fix it until I had free time to use it either.
Same here. I’m the only user of my services, so if I try visiting the website and it’s down, that’s how I know it’s down.
I prefer phrasing it differently, though. “With my current uptime monitoring strategy, all endpoints serve as an on-demand healthcheck endpoint.”
One legitimate thing I do, though, is have a systemd service that starts each docker compose file. If a container crashes, systemd will notice (I think it keeps an eye on the PIDs automatically) and restart them.
What happened to grafana and Prometheus?
I have been putting off rebuilding my home cluster since moving but that used to be the default for much of this and I’m not hearing that in these responses.
While I love and run Grafana and Prometheus myself, it’s like taking a RPG to an ant.
There are simpler tools that do the job just fine of “is X broken?”.
Even just running Portainer and attaching it to a bunch of standalone Docker environments is pretty good too.
I rely on the developers putting in a health check, but few do.
I’ve also got uptime kuma setup, which is kinda like an external healthcheck.
i just let kubernetes handle it for me. k3s specifically.
Maybe a transition to a cluster homelab should be the goal of 2026, would be fun.
maybe! three raspis and k3s have served me mostly well for years, tho with usb/sata adapters cuz the microsd was getting rather unreliable after awhile
Nice one that, fortunately i just rebuilt my server with an i5-12400 new fancy case amd slowly transitioning to an all in ssd build! I would probably lean towards a singlenode cluster using Talos.
I haven’t heard of Talos before, sounds like it’s not fully open source?
Talos is really awesome, its a minimal OS strictly built to run kubernetes. We use it at work and its running in production for a lot of people. Its extremely minimal and can only be used via its own api, talosctl command. Its minimalism makes it great for security and less resource heavy than alternatives.
Check this out for a quick’ funny taste of why one should consider using Talos >>
[60sec video from Sidero Labs, creators of Talos] www.youtube.com/watch?v=UiJYaU16rYU
Talos is under MPL 2.0, afaik that is open-source.
To add to that: health checks in Docker containers are mostly for self-healing purposes. Think about a system where you have a web app running in many separate containers across some number of nodes. You want to know if one container has become too slow or non-responsive so you can restart it before the rest of the containers are overwhelmed, causing more serious downtime. So, a health check allows Docker to restart the container without manual intervention. You can configure it to give up if it restarts too many times, and then you would have other systems (like a load balancer) to direct traffic away from the failed subsystems.
It’s useful to remember that containers are “cattle not pets”, so a restart or shutdown of a container is a “business as usual” event and things should continue to run in a distributed system.
Thanks for your input 👍
A superb image will have a health check endpoint set up in the dockerfile.
A good image will have a health check endpoint on either the service or another port that you can set up manually.
Most images will require you to manually devise some convoluted health check procedure using automated auth tokens.
All of my images fall into that latter category. You’re welcome.
(Ok, ok, I’m sorry. But you did just remind me that I need to code a health check endpoint and put it in the dockerfile.)
I use uptimekuma with notifications through home assistant. I get notifications on my phone and watch. I had notifications set up to go to a room on my matrix homeserver but recently migrated it and don’t feel like messing with the room.
I assume you then also use apprise as middleman here or?
Negative. All done in uptimekuma/HA. You’ll need an access-token from your home assistant server but it’s pretty straightforward.
Oh damn, how nice! Ill look into that for sure 😊
2, no, just check the docs.
3, yup
You can make your own health checks in docker compose, so for instance, I had etcd running provided by another company, and I just set up the check in compose using the etcdctl commands (etcdctl endpoint health).
docs.docker.com/reference/compose-file/services/#…
You can read the Dockerfile for the HEALTHCHECK clause however not all have it as it’s been introduced in later docker versions.
You can also write your own using things like curl.
HEALTHCHECKis part of the Dockerfile syntax and ought to be supported by all your container runtimeshttps://docs.docker.com/reference/dockerfile/#healthcheck
You could extend all the dockerfiles that don’t have a health check to implement this feature with whatever health check makes sense for the application, even if for now it’s just a curl of an endpoint.
This is a neat little inspect command indeed!
So I’m also using Beszel and Ntfy to track my systems because it’s lightweight and very very easy. Coming from having tried Grafana and Prometheus and different TSDBs I felt like I was way better off.
I’ve been following Beszels development closely because it was previously missing features like container monitoring and systemd monitoring which I’m very thankful for them having added recently and I use containers as my primary way of hosting all my applications. The “Healthy” or “Unhealthy” status is directly reported by Docker itself and not something Beszel monitors directly so it has to be configured, either by the configuration in the Dockerfile of the container image or afterwards using the healthcheck options when running a container.
As some other comments mentioned, some containers do come with a healthcheck built in which makes docker auto-configure and enable that healthcheck endpoint. Some containers don’t have a healthcheck built into the container build file and some have documentation for adding a healthcheck to the docker run command or compose file. Some examples are Beszel and Ntfy themselves.
For containers that do not have a healthcheck built into the build file it is either documented how to add it to the compose or you have to figure out a way to do it yourself. For docker images that are built using a more standard image like Alpine, Debian or others you usually have something like curl installed. If the service you are running has a webpage going you can use that. Some programs have a healthcheck command built into it that you can also use.
As an example, the postgresql program has a built in healthcheck command you can use of that’ll check if the database is ready. The easiest way to add it would be to do
    healthcheck:
      test: ["CMD", "pg_isready", "-U", "root",  "-d", "db_name"]
      interval: 30s
      retries: 5
      start_period: 60s
That’ll run the command inside the container
pg_isready -U root -d db_nameevery 30 seconds but not before 60 seconds to get the container up and running. Options can be changed depending on the speed of the system.Another example, for a container that has the curl program available inside it you can add something like
    healthcheck:
      test: ["CMD", "curl", "-f", "http://localhost:3000/"]
      interval: 1m
      retries: 3
This will run
curl -f http://localhost:3000/every 1 minute. If either of the above examples would exit with an exit code higher than 0 Docker would report the container has unhealthy. Beszel will then read that data and report back that the container is not healthy. Some webThanks for this very in depth answer, learned a lot from this 🫶
I just put a healthcheck in my compose files and then run an autoheal container that will automatically restart them if they are “unhealthy”.
Dozzle will tell you just about everything you want to know about the health of a container. Sadly, to my knowledge, it does not integrate with any notification platforms like nfty, even though there is a long standing request for that feature.
Jupp running that too 😅 Was not aware of the pensing feature, ill keep my eyes open for that in the future!